


With Power BI, you visualise data connect systems gain insights empower decisions
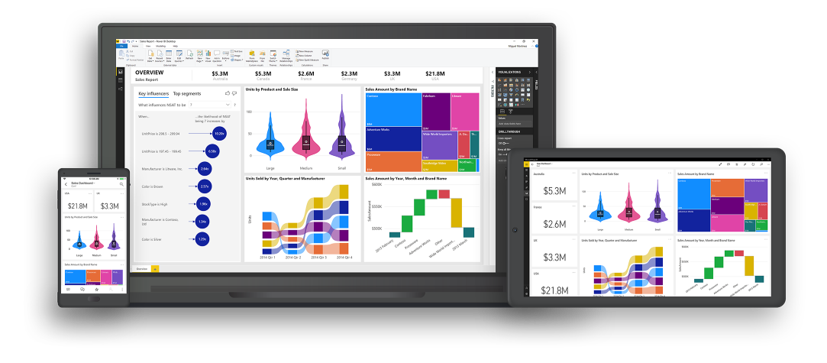
Power BI is the business intelligence application of the Microsoft 365 suite. It presents data consolidation and analysis in visually meaningful graphs, diagrams and KPIs. Power BI Dashboards can be embedded in SharePoint pages and Power Apps screens.
Power BI is like Excel graphs on steroids. It lets you compare and analyze data from various sources to produce real actionable insights into your business data. It saves significant admin reporting time. We can help you to transform and connect your data just once, then a scheduled refresh repeats the process ongoing with interactive and always up to date reports.
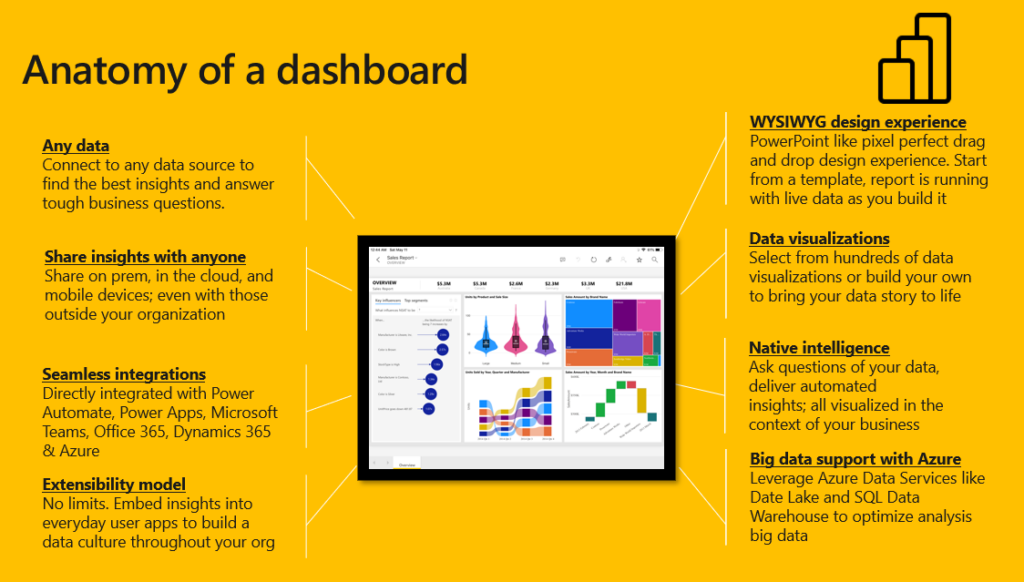
- WYSIWYG design = What You See Is What You Get. Drag and drop pixel-perfect design
- Make sense of your data with ease, and drive quick and confident decisions across your organization
- Reduce the amount of time spent in data prep and spend more time getting answers with AI-driven insights.
- Automatically scheduled data synchronization from multiple sources, brought together with simple or complex relationships, e.g. matching the client name across Xero and CRM
- Real Microsoft Artificial Intelligence can auto-create suggested reports and answer human-language questions about your data. e.g. respond to “who was our most profitable performing customer last month” where data contains columns for ‘customer’ and ‘$$’
- Remove the complexity of managing multiple analytics solutions with a single, unified platform that gives every employee access to insights
Power BI FAQs
The free license of Power BI provide full functionality, including connecting to any data source and building complex reports in Power BI desktop. The Power BI Pro license, which is the first level of premium subscriptions, allows you to securely publish and embed your report to the rest of your organization. Any user who wants to view the shared dashboard report will need a Power BI Pro license. Using the free license, you could just save and communally open the desktop file, however there is a risk that less experienced users could open and upset the calculations or design of the dashboard. There are also enterprise-level Power BI plans that allow for consumption-based billing, and public website hosting; reach out and we can guide you through the licence requirements based on your specific use case.
If there is data, Power BI can most likely connect to it. There are dozens of connectors available out of the box. There are also connections to Excel, CSV, SQL, JSON, XML and other raw data formats, including connecting to AWS and non-Microsoft data types. You can setup live data or scheduled refreshes to a system with an API (Search the name of your tool and “api documentation” or contact them to see if they have the ability for Power BI to connect to). Even on-premises data bases can be used if a secure gateway is installed. In worst case scenarios, manual exports from a non-integration-friendly system was required, but saving the data-dump in a central location is sufficient for Power BI to retrieve, transform and compile the data in an automated way.
Yes. You can share a report with a named user on the Power BI pro licensing if they are invited as an external user. Or you can setup higher level licensing with the hosted plans and have client/supplier/external portals that allow for rich filtering, and each customer to see their own filtered content on the same report, and login to a central portal using a non-Microsoft authentication, or keyword, or even a secret personalized link per client that they don’t need to sign in to.
Typically, there are usually 2 key ways to start.
1. review what data you have, understand what is possible, and what information you could retrieve that would be valuable. Then once you have data-driven dashboards, consider what is missing, and need to be built out.
2. Blank-canvas it, and decide what metrics you would WANT to know about your business, profitability? product margins? staff turnover? staff utilization efficiency? Then look back at your data and determine where you have information that could answer the questions, and create manually reporting to fill gaps until your systems can catch up.
We can help work through which approach is best for you, and continue the journey through not just meaningful KPIs, but actionable traffic-light decision making scorecards to gauge the pulse of your business at a glance.
If the graphics/visuals are the same, and you just want to filter the data, you dont need to! Power BI has RSL (Row Level Security) which means you can set up the different rows of data to below to different security groups and show and hide to only the relevant viewers. e.g. national sales managers see all data, but NSW Sales manager only sees the sate-wide information, and further layers for regional managers and store-based information.


 1300 228 744