
Microsoft have recently announced the arrival of a new ‘guided authoring experience’ within Lists.
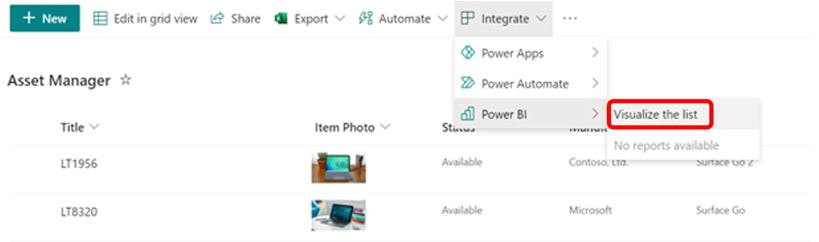
What does this mean? It will now be even easier to create business intelligence reports in Power BI using list schema and data. Rolling out in early May, users will see a new menu option in Integrate > Power BI > Visualize this list allowing users to create a new Power BI report and customise the list columns that are shown in the report.
Power BI’s advanced data visualization capabilities can be used to its full capabilities via the Edit mode. Once a report is saved and published, it will appear in the same submenu under Integrate > Power BI.
It is important to note:
- Users with a Microsoft 365 E5 licence or Power BI Pro licence will have access to the full report authoring and viewing experience.
- Users without either of the above licenses will be prompted by Power BI to sign up for a 60-day free trial of Power BI Pro when they attempt to save a new report or edit or view an existing report.
So what is required in order to prepare?
By default this feature is on, however it can be turned off from the Power BI Admin Portal under Tenant settings.
* If this feature is disabled for tenants, users will continue to see the Power BI submenu in the List command bar, but any attempt to create or view a report will result in an error page.
* Certain complex column types in Lists such as Person, Location, Rich Text, Multi-select Choice, and Image are not currently supported when the Power BI report is autogenerated.
If you’d like to learn more, make sure to contact our team at 365 Solutions Group to find out how we can assist you!
Book a chat with one of our team here to learn how this feature can help your organization to be more efficient.


 1300 228 744